
The Case for using Dew Point for Testing ESD Control Materials
All ESD Association (ESDA) standards that are used to evaluate the properties of ESD controlled materials require testing under defined temperature and relative humidity conditions. Although the exact values vary by standards document the typical environmental conditions are:
• Low Relative Humidity – 12% ± 3% RH and 230 C ± 30C
• Moderate Relative Humidity – 50% ± 5% and 230 C ± 30C
It is a well established fact many ESD control materials are affected by the presence of moisture in the air. Both the temperature and humidity values have “±” tolerances associated with them which are historically based on the equipment used to control these parameters.
The goal of standards is to develop test methods that are not only repeatable (within the lab making the measurement) but also reproducible between labs. In order to achieve this several key factors need to be controlled. The typical factors that need to be controlled when making resistance measurements are:
• Resistance Meter Test Voltage
- Under load versus open circuit measurements
• Meter current limitations
• Meter Electrification Time
• Fixture design – weight, electrode conductivity and durometer
• Sample conditioning period
• Conditioning environment – Temperature and relative humidity
This white paper looks at one study conducted by the ESDA Standards Committee. The study attempted to determine whether or not resistance readings would be affected by the temperature and humidity tolerances used in ESDA standards.
First we need to look at some definitions:
Relative Humidity is the ratio of the actual amount of water vapour present in a volume of air at a given temperature to the maximum amount that the air could hold at that temperature.
Specific Humidity represents the amount of water vapour present in a unit volume of air. It is usually expressed as the weight of the moisture in a pound of dry air. One grain of moisture equals 0.000143 pounds. It is also called the Humidity Ratio.
Dew Point Temperature is the temperature where water vapour in air will condense on a surface.
The amount of water vapour present in the air is quite a bit different even looking at the temperature and humidity tolerances at low RH values. For example, if we take the low temperature/humidity extremes in the ESDA’s documents we are dealing with:
• Lowest values – 9% RH and 200 C (680F)
• Highest values – 15% RH and 260 C (790F)
By using a Psychometric chart similar to that found in Figure 1, we can determine the actual amount of moisture in the air at these temperature/humidity extremes.
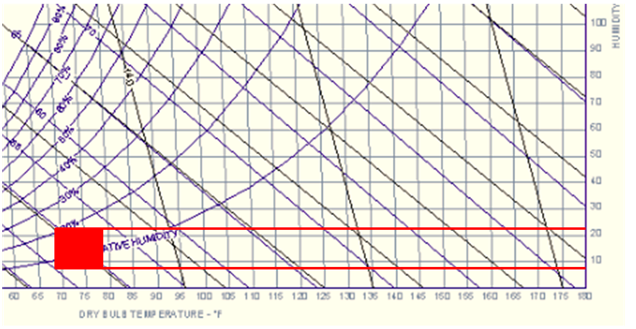
Figure 1– Psychometric Chart
The chart indicates that, at the low end of the ESDA’s temperature/humidity range (9% and 200C) there are nine grains of moisture per pound of dry air. At the high end of the range (15% RH and 260C) there are 22 grains of moisture per pound of dry air. Based on the moisture content alone there is 2.5 times as much moisture present in the air at the high end of the ESDA’s environmental range for testing. If the resistance of ESD control materials is affected by moisture then this moisture range could be a source of measurement error in all of the ESDA’s published testing documents. To test this theory, eight protective packaging materials were tested at the RH and temperature extremes of 200C/9% RH and 260C/15% RH and the results are shown in Graph 1.
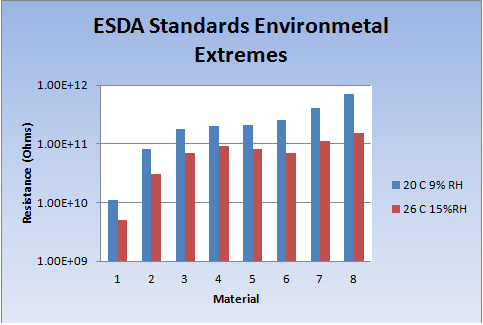
Graph 1- Resistance Readings at 9% and 15% RH
The materials tested all showed lower resistance values in the environment with the higher moisture content. An analysis of the resistance readings show that the resistance values at 260C and 15% RH were on average 65% lower than the values obtained at 200C and 9% RH. For the packaging materials numbered 3, 4, 5 and 6 a lab testing the materials at 9% RH would classify these materials as insulators while the lab testing at 15% would classify the materials as static dissipative. However, both labs have complied with the ESDA’s required environmental conditions.
One idea was to control the specific humidity instead of relative humidity. In this case, if the moisture content of the air were to be controlled (i.e. grains of moisture per pound of dry air) would it be possible to reduce the variations in resistance readings? Since dew point is directly related to specific humidity, controlling the conditioning environment using dew point may provide more consistent resistance readings.
The following chart shows the relationship between relative humidity, dry bulb temperature, Dew Point and the Specific Humidity.
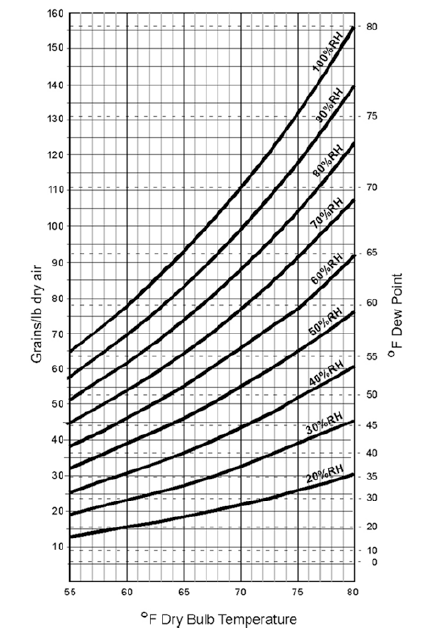
Relationship – Specific Humidity/Dew Point/RH and Dry Bulb Temperature
A second test, using the same materials, was conducted where the specific humidity was controlled. The ESDA temperature range was maintained however the specific humidity was controlled at a dew point of -10C. As with the previous test the samples were conditioned for 48 hours. The results are shown in Graph 2.
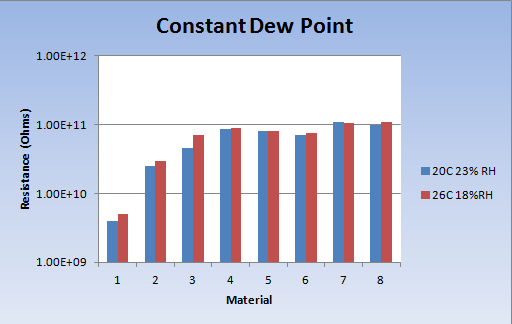
Graph 2 – Constant Dew Point
The average resistance value for these eight material samples were within 11% of each other. Labs testing at the different temperature and RH conditions would each classify the packaging materials the same way. Samples 1 through 6 are static dissipative while samples 7 and 8 would be classified as insulators. This seems to indicate that controlling the moisture content of the air rather than temperature and humidity separately provides more repeatable results over the temperature range allowed by ESDA standards.
In order to further validate this theory additional tests were conducted over a wider temperature range. The data for the materials from the 200C and 23% RH test were compared to the data for the same materials that were re-conditioned and tested at a temperature of 380C and 9% RH (dew point of -10C). The results were almost identical to the previous constant dew point test. The average reading was with again within 11% of each other even with the larger temperature and RH variation.
Graph 3 shows the results of the testing. All of the materials, with the exception of sample 7, would have resulted in the same classification when using ANSI/ESD STM 11.11. Samples 1-6 would be classified as static dissipative and sample 8 would have been classified as an insulator. Sample 7 would be classified as an insulator at the lower temperature extreme for some unknown reason.
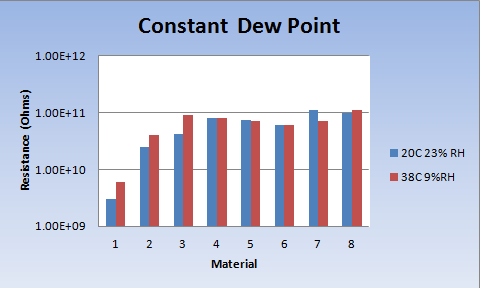
Graph 3 – Wide Range Constant Dew point
Conclusion:
The environmental moisture envelope currently specified in ESD Association test methods is a source of some variation when making resistance measurements.
Labs testing at the allowed temperature and humidity extremes could have results that cause conflict and confusion.
Recommendation:
The use of dew point control might allow users to test at wider temperature ranges for ESD applications that have temperatures that differ considerably with the existing standard testing temperatures.
In the short term the ESD Association standards committee should investigate the affect that the current moisture/temperature range is having on test results in an attempt to repeat the results in this paper.
If the results are repeated they should consider the tightening of the current temperature and humidity envelope. This would help minimize the variation in the resistance measurement results.
At the same time the ESD Associations Standards Committee should also investigate allowing the use of Dew Point control (in addition to temperature and humidity control) for those labs who might wish to have more repeatable measurement results.